How is the research at Harmonic Timing organized? Why is this so critical?
For each market that is analyzed our research process goes through a disciplined five step process. The results of these steps are then combined into a forecast.
In 1946 W.D. Gann wrote, “Whenever you start to make up a forecast one year or more in advance always check back and see if the market is running out a major cycle or a minor cycle.”
1) The first step in the analysis is to lay out how Gann’s Major, Long-Term Cycles are currently impacting the market under study. In soybeans it is critical to understand that Gann’s 30-Year Cycle bottomed and turned up during July 1999. His 84-Year Cycle bottomed and turned up during October 2001. His 82-Year Cycle bottomed and turned up during July 2003. The one-third division of Gann’s 82-Year Cycle bottomed and turned up during October 2004. Knowledge of how these cycles unfolded in the past gives critical information on how soybeans are likely to unfold in the future.
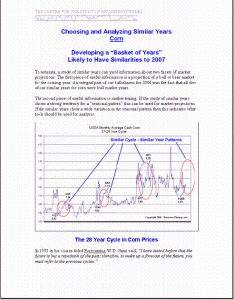
 2) Using the information developed in step one, the second step in our research is to develop a number of years that had cycles similar to the period under study.
A study of similar years can yield information about two facets of market projections. The first piece of useful information is a projection of a bull or bear market for the coming year.
Another piece of useful information from studying similar cycle years is market timing. If the study of similar years shows a strong tendency for a “seasonal pattern” this can be used for market projections. If the similar years do not show a seasonal pattern then this indicates other tools should be used for analysis.
In 1935 in his course titled Forecasting W.D. Gann said, “I have stated before that the future is but a repetition of the past; therefore, to make up a forecast of the future, you must refer to the previous cycles.”
3) The third step in our research process is to analyze our monthly and weekly proprietary cycles. These monthly and weekly cycles are intervals or divisions of Gann’s Major and Minor Cycles. Measurements of these shorter-term proprietary cycles begin at MAJOR cycle highs and lows. In the soybean example this means we measure our cycles from July 1999, October 2001, July 2003, etc.
Ideal measurements from past highs and lows of our shorter-term cycles result in a Cycle Turn Window. These ideal measurements from recent turning points will typically result in a window of two to three weeks.
A cluster of measurements of different cycles to a specific time interval results in a high probability change of trend. Those who know future turning points can reap large profits.
4) The fourth step in our research process is the projection of probable price targets for the period under study. The principle underlying our price target projections is that price swings of similar degree will relate to each other in proportion. Swing highs or lows will relate to past swings of similar degree. A cluster of price projections within a small range is meaningful and a sign that traders and producers should be alert for a change of trend at that price level.
5) The fifth step in our research process is the analysis of technical and sentiment data. While much of the prior four steps can be done weeks and months in advance, technical and sentiment analysis is done in real time.
Technical analysis is primarily designed to determine if the market under study is “overbought” or “oversold.” Since markets can remain overbought or oversold for long periods of time, it is critical to have “triggers” that tell when a turning point has actually been made.
Over decades of trading I have learned that contrary opinion of market sentiment is a useful tool. Market sentiment constantly swings between optimism and pessimism. When bullish market sentiment is quite high it is a sign that the euphoria is likely to come to an abrupt halt. Conversely, when “everyone” is bearish it is a sign to be prepared to be a buyer. These extremes present golden opportunities to capitalize on crowd behavior.
Our systematic approach of these five steps results in a complete, objective, and unbiased forecast of a market.
